


A previous post introduced projects that focus on ultra-poor households, in Bangladesh and India. The post ended with a promise to share the results of the impact evaluation of the project implemented by SKS in Andhra Pradesh, India. The results I share here are preliminary. Additional data and finer analyses are on the way, but I wanted to deliver on that promise.
In a nutshell, the Targeting the Ultra-Poor (TUP) projects being implemented around the world are an attempt to reach destitute households, who are often too poor to participate in microfinance, and help them create a sustainable livelihood based on a modest economic activity. Participants receive food, free health care, training, savings help, and assets (a cow, a few goats, working capital to start a small business) over a period of 18 to 24 months. The programs are not microfinance programs, both because of the population that they target and the activities that they include. Their main goal is to attack ultra-poverty holistically, although they also aim to help successful participants take advantage of microfinance.
In Andhra Pradesh, we surveyed about 1000 households from 207 villages in 2007, before the program started, and twice after it ended (in 2009 and 2010/2011). The data I use here are from the first post-program survey, completed just at the end of the program. Several interesting findings came out of the surveys.
We learned that although the participants are very poor, they had an active financial life even before the program started. On average, program participants are middle-aged, illiterate, single women in charge of more than three household members. In a region where agriculture is the main economic activity, 63% of participating households do not own any land, and the average income before the project was 58 US cents per person and per day (on a purchasing power parity basis, which takes into account the difference in the cost of living between the US and India). Despite their low income and poor condition, 2/3 of households had outstanding loans, principally from self-help groups, and more than 50% of households had savings.
We measured the impact of the program by comparing households that were randomly assigned to participate to households that were randomly assigned not to participate. Three main results stand out.
First, the program did not cause major changes in consumption and income. Consumption and income increased between the two waves of survey, but not more so for households participating in the program than for non-participants. Figure 1 below shows changes in total monthly income and selected components of income: total income increased for both groups over the course of the project, by about $15.50, but not significantly more for participants than non-participants.
Figure 1. Change in monthly income before and after the program.
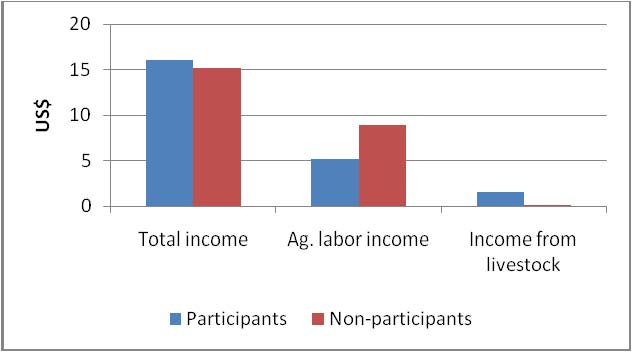
Although total income did not increase significantly more because of the program, the sources of income shifted. As Figure 1 shows, income from agriculture labor (i.e. daily work in other farmers’ fields) increased significantly less for participating households, but livestock income increased significantly more for participants. This is logical given that most participating households chose to receive a cow or goats from the project.
Second, the project did change households’ use of financial instruments (see Table 1). On the savings side, the increase in the number of households that reported having any savings was significantly larger for participating households than non-participating households. This is not surprising, as the program includes a savings component. Participating households increased their savings balance more than non-participating households, but the difference is not statistically significant.
On the credit side, the opposite findings emerged: the likelihood to borrow was not different for participating and non-participating households (note that both groups of household reduced their use of credit), but participating households decreased their amount of loans outstanding, while non-participating households increased it.
Table 1. Change in the use of financial instruments.
Change in the...
% households Total savings % households w/ Total loan amount
Participants 25% 42.8 -4% -14.7
Non-participants 12% 36.5 -1% 114.1
Finally, other outcome measures were impacted by the program to various degrees. Asset ownership by participants did not increase significantly more over the course of the program than asset ownership by non-participants. Agricultural asset ownership did increase for participants as a direct result of the transfer of cows and goats, but this is not an impact of the project. Both participating and non-participating households also continued taking part in the government safety net programs, such as buying food from government stores at subsidized prices. Lastly, school attendance of children in the households also did not increase more for participants than non-participants.
In conclusion, these short-run results are encouraging, but they do not point to a dramatic positive impact of the program on households’ life. The shift in income composition suggests that the program helps households build a sustainable self-employment-based livelihood, with more regular income. The short-term nature of the results is important to bear in mind. The last round of surveys, done in December 2010 and January 2011, one year after completion of the program, will provide more valid longer-term results.